

Oahu Hawaii Real Estate Statistics & Analysis
Aloha!
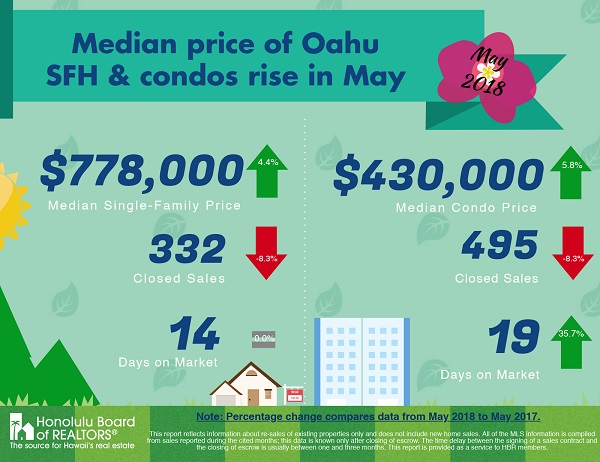
Here are the June 2018 (May Data) Oahu Hawaii Real Estate housing statistics courtesy of the Honolulu Board of Realtors – Hawaii Housing Stats, May-2018. In 2018 the housing market on Oahu continues to break median sales price records at a steady pace with overall prices increasing unabated – so far. However, from January thru May of 2018 we have seen the actual number of sales for both condos and homes decrease – compared to the same month in 2017 – for 3 out of 5 of the last months. DOMs (Days on Market) for condos jumped by 20% in April and by 35.7% in May. One more month and this upward trend of DOMs (and inventories) becomes statistically significant. Just after a long term real estate cycle peaks the first indicator is a decrease in sales followed by an increase in inventories. Once that continues prices inevitably flatten. We will will be watching the trend closely to see if it is just an anomaly. Interest rates are still relatively and historically low while the economy is continuing to expand at a good pace. The wild card though is this administration’s Trade War policy which, at the time of this writing, to continue with no sides back down. I wrote about the possible ramifications of a Trade War in my April 2018 Hawaii Damon Newsletter. As for this months detailed stats we have, in summary:
Overall Oahu Real Estate Sales have decreased by -8.3% in May for Single Family Homes while also decreasing by the same -8.3% for Condos compared to the same month last year. The YTD (Year-To-Date) data shows an overall sales decrease of -1.7% for Single Family Homes along with a increase of 1.1% for Condos compared to last year. The overall combined trend for the year thus far is trending downwards (this is the first time I have reported the trend downwards since starting the Hawaii Damon Newsletter).
Median Oahu Real Estate Prices have increased by 4.4% and 5.8% respectively for Single Family Homes and Condos compared to the same month last year while YTD median prices have increased by 4.8% and 6.5% respectively. The overall trend is still upward (the notable exception would be the Hawaii luxury homes areas).
Oahu Real Estate DOM (Days on Market) YTD (Year-To-Date) indicator stayed the same at 17 days for Single Family Homes compared to last year. YTD DOM for Condos increased by 1 day to 18 days compared to 17 days for the previous year. As mentioned above we did see a drop in sales by 20% and 35.7% respectively for April and May this year. If the trend turns downward the next signal will be with DOMs increasing. For it to be statistically significant we would have to see DOMs increase for 3 months. We will definitely be watching this indicator closely for the next two months. (Note that Luxury Home areas are still experiencing large inventories – avg. 15.2 months (May) but slightly dropping from 15.6 months a year ago for homes over $1.9M – though definitely and finally decreasing, we are still in extreme Buyers’ Market territory for some of these Oahu Luxury Home neighborhoods).
For the detailed report with a breakdown by neighborhood please see: Oahu Neighborhoods Real Estate Statistics (May 2018 Data). Please note that the overall stats for Luxury Homes in Hawaii are very different from that of the Median Home Areas whereas Luxury Home inventory – though coming down- is still high pushing downward pressure on prices in those neighborhoods i.e. Buyers’ Market (Median Home areas are Sellers’ Markets). On the other hand, the fear of rising interest rates are creating pressure on prices in the median neighborhoods where the majority of homes are purchased through financing.
Hot Tip – If you are thinking of upgrading to a Luxury Home from a Median Home, now would be a great time to sell your current home and upgrade to a Luxury Home neighborhood. Please call me for details.
Please check out January’s newsletter’s very important article: Tax Reform vis-a-vis Hawaii Property Prices and Your Bottom Line. If you have a family, school and education should be a priority so please do not miss February’s: Best Schools on Oahau – Private vs Public & Property Values. For more information about whether your neighborhood is in a Buyers’ or Sellers’ Market (or if you are a Buyer – the neighborhood you are interested in) please check out my previous blog/newsletters here: Buyers’ or Sellers’ Market? Absorption Rate is the Key and The Latest Buyers & Sellers Market Data on Many East Oahu Areas – Know Before Buying or Selling! (Just Updated May 2018!)
For more analysis of what all this means for Real Estate in Hawaii in 2018 – including tips and marketing strategies for both Buyers and Sellers – please check out my June Newsletter (focus on Buyers) and July Newsletter (focus on Sellers). August Newsletter showcased the Ward Village Condo development! In the September Newsletter we learned how to calculate CAP (capitalization) rates for your investment. October’s Newsletter showed inventory figures for 8 popular Luxury and Semi-Luxury home neighborhoods in East Oahu! These and other months’ newsletters can be found on the Blog section of my website: hawaiidamon.com/blog
Please check out this site’s easy to use Search Tool to find current listings of Hawaii Real Estate now on the market. Homes for sale in Oahu and condos for sale in Honolulu (Waikiki, Ala Moana, Kakaako, Hawaii Kai etc.) can all be found here using the Hawaii Condo Search or Hawaii Home Search tools.
Aloha!
Damon Rhys